AI in Radiology, Issue 2: Deploying and Monitoring PE Detection at Scale
The monthly RadBrief AI digest. What an FDA-cleared PE tool actually does once it is deployed across a real network, plus how to tell when a deployed model starts to slip.
Most AI radiology papers are model development. They show you an AUC on a held-out test set and stop. This month’s featured paper does something rarer. It reports what an FDA-cleared PE tool actually does once it is running live across a real network, not how it scores on a curated test set. If you run PE AI in your practice, or you are thinking about it, this is the one to read. A shorter companion paper follows, on how to keep a deployed tool honest.
Featured: what real-world PE AI looks like at scale
Goldberg-Stein et al., Radiology: Artificial Intelligence, 2026. DOI: 10.1148/ryai.250017
Northwell Health’s integrated network in suburban-urban New York ran 32,501 CTPAs through Aidoc PE detection (FDA-cleared, v1.3) over about 18 months, August 2021 to February 2023. 135 radiologists across the system, all trained on the AI widget. Every radiologist-AI disagreement was adjudicated by thoracic radiologists through an internal AI Quality Oversight Process, and the adjudicated read became the reference standard for those discordant cases. This is the rare paper that reports what happens after deployment, not how a model scores on a curated test set.
The headline numbers:
Overall radiologist-AI concordance: 97.79% (31,782/32,501)
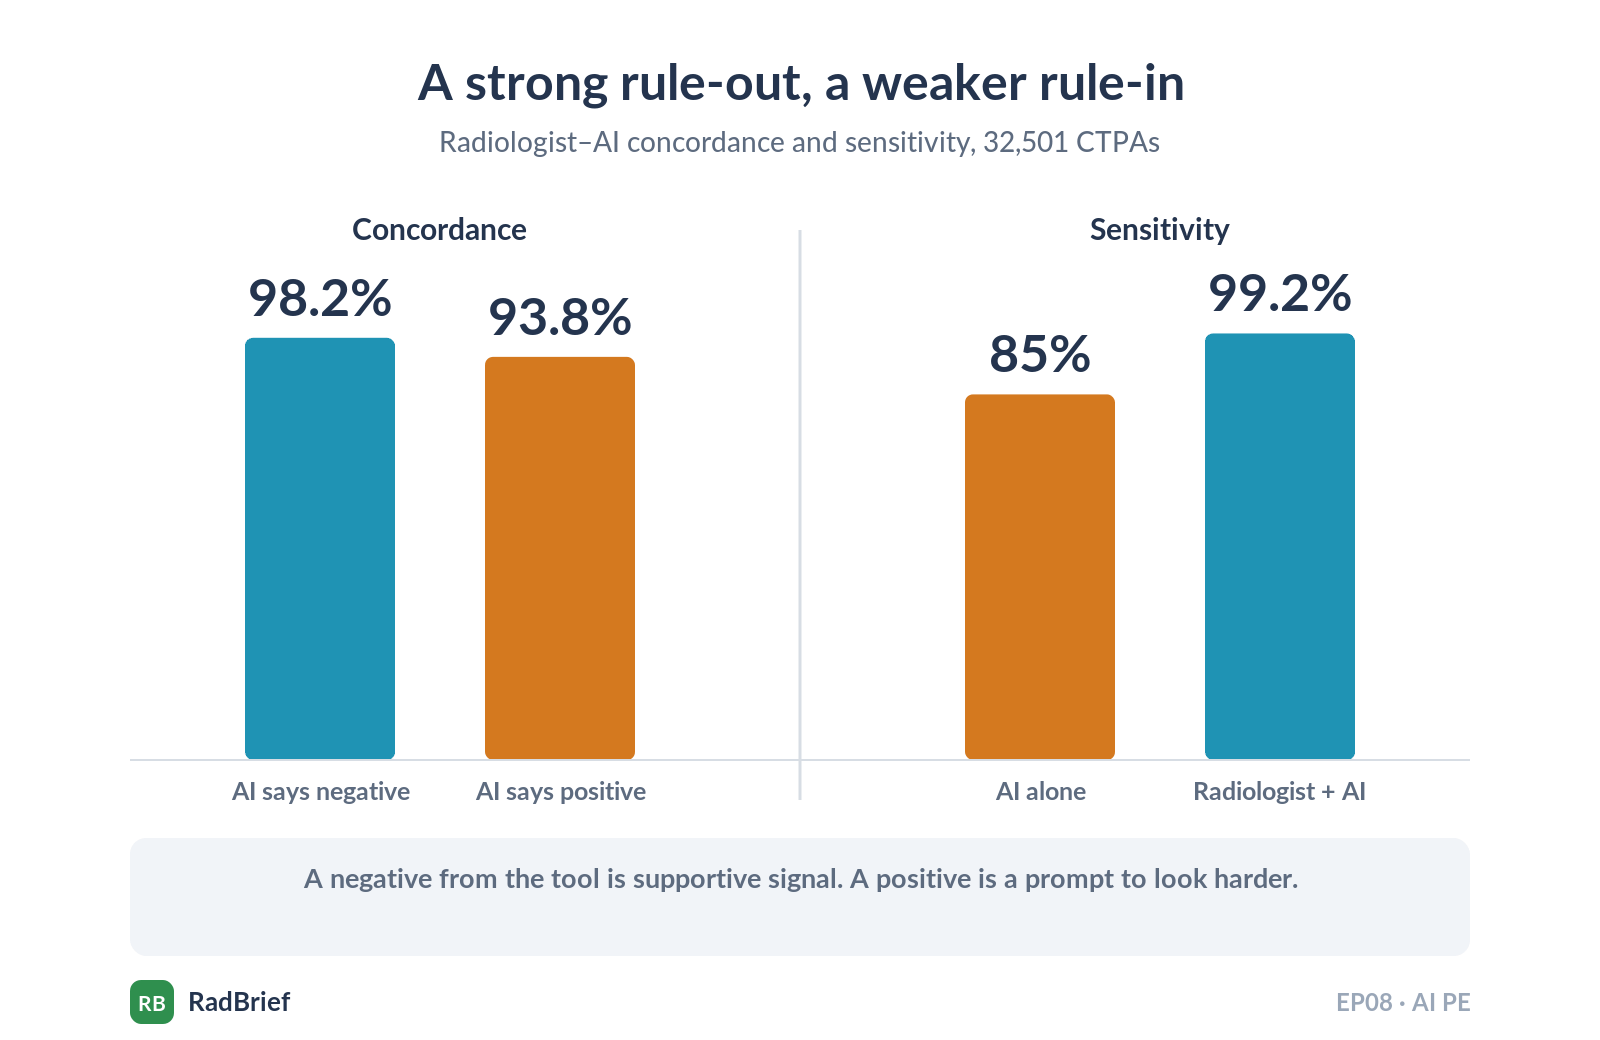
AI-negative exams: 98.18%. AI-positive exams: 93.75%
AI-informed radiologist sensitivity: 99.19%. AI-alone sensitivity: 85.03%
Adjudication favored the radiologist in 88.73% of discordances
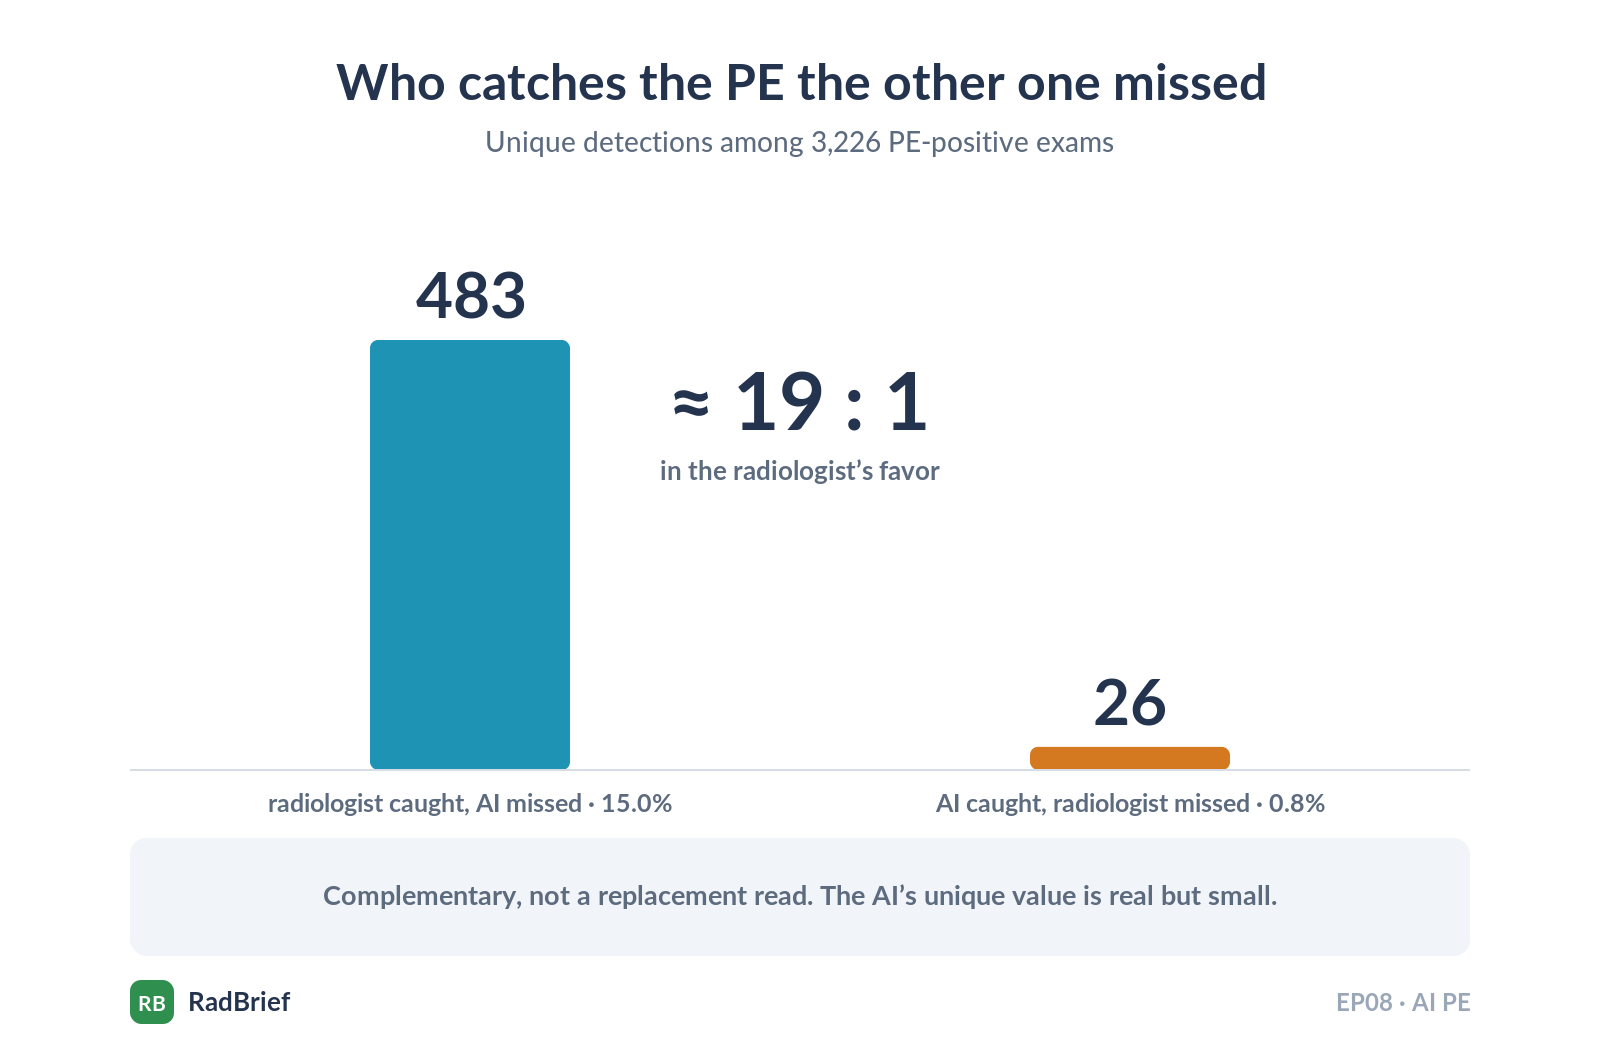
Among 3,226 PE-positive exams: radiologist caught 483 (14.97%) the AI missed; AI caught 26 (0.81%) the radiologist missed. Roughly 19 to 1 in the radiologist’s favor
Concordance by location: central 95.79%, lobar/segmental 83.81%, subsegmental 58.62%. By chronicity: acute 87.34%, chronic 60.12%
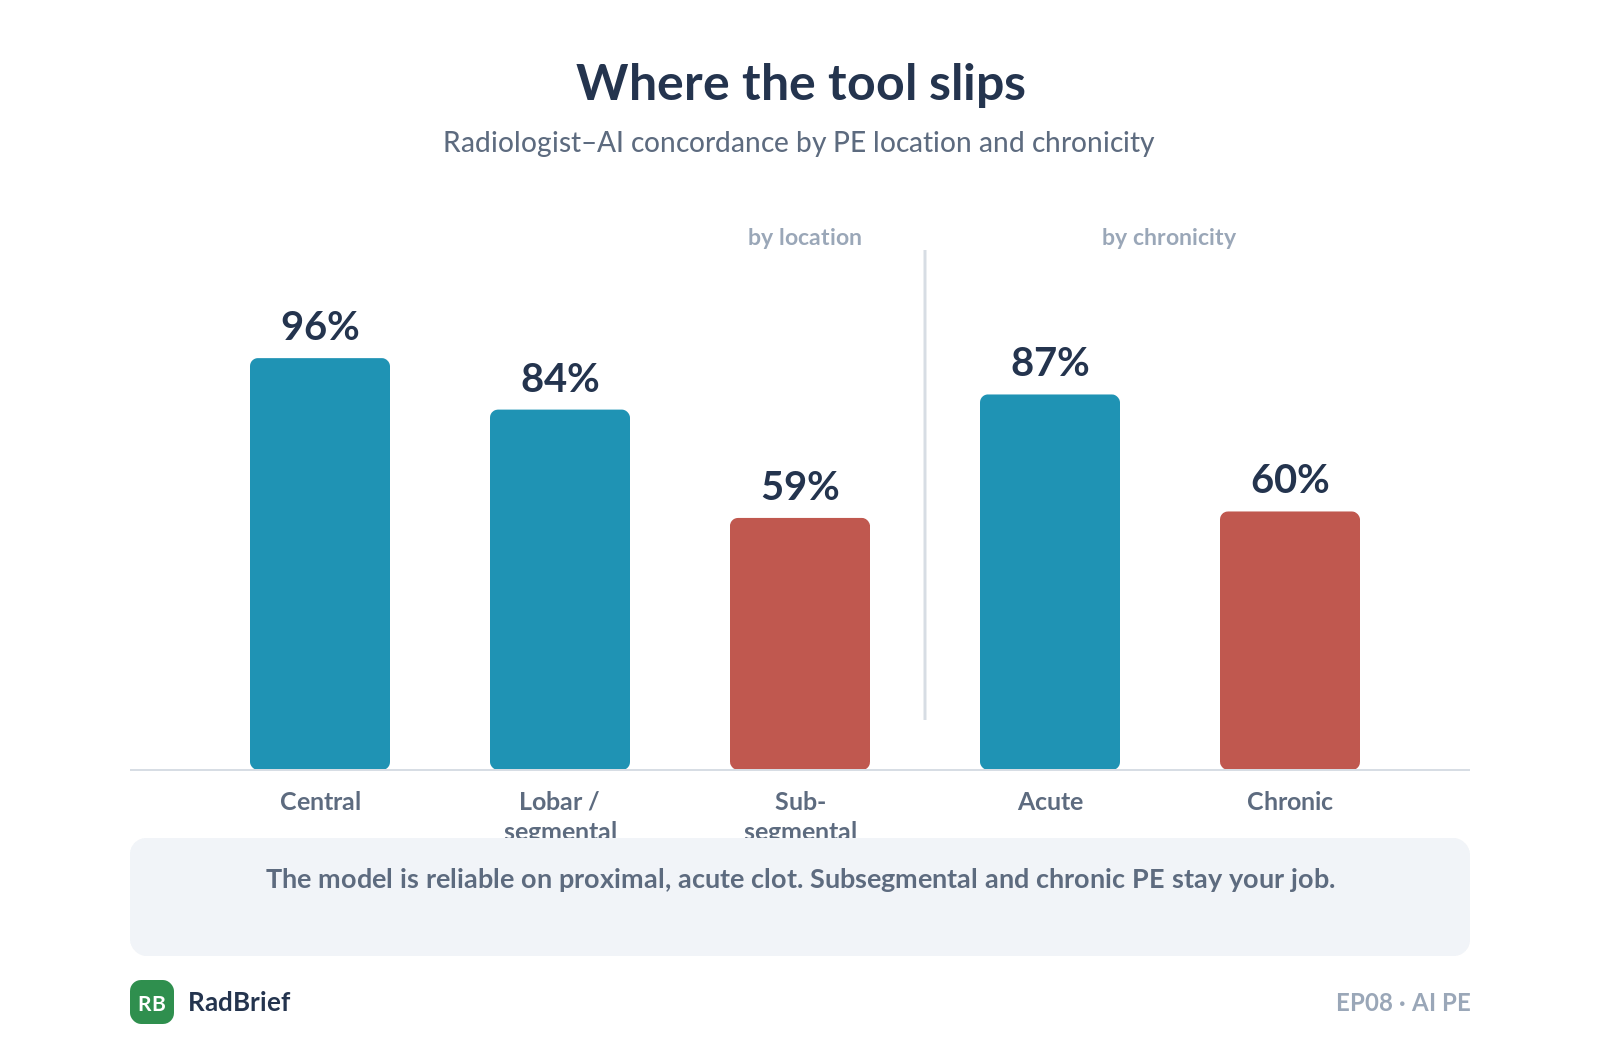
What this means at the workstation. Aidoc finds a few PEs you miss, but you find far more that it misses, and the unique value is concentrated in central, lobar, and acute clot. Subsegmental and chronic PE are still your job. I think the number to hold onto is not the 97.79% headline, it is the asymmetry: concordance drops from 98.18% on AI-negative exams to 93.75% on AI-positive ones, and AI-alone sensitivity is 85% against 99% for the AI-informed radiologist. So the tool is a strong rule-out. When it calls a positive, you still look carefully.
I think this is the most useful AI radiology paper of the last six months, and not because the algorithm is novel, because it isn’t. It is useful because it is deployment data at scale, on an FDA-cleared product, with structured adjudication, in a real network. Most papers stop at the test set. This one keeps the camera rolling.
What the abstract doesn’t tell you
The reference standard is imperfect, and the authors say so. Only discordant cases were adjudicated. Concordant cases were assumed correct. That biases the apparent performance of both the radiologist and the AI upward, so read the accuracy figures as a ceiling, not a measurement.
The adjudicators were unblinded. Experts working inside an AI-assisted workflow may have tilted borderline calls toward the AI output, which would inflate the AI’s apparent metrics. But the AI-informed radiologists still beat AI alone despite that tilt, which makes the oversight conclusion stronger, not weaker.
Experience did not matter. Agreement was essentially flat across under 5, 5 to 10, and over 10 years (P = 0.67). So this is not a crutch for junior readers, the way the PCN-AI paper in Issue 1 was. It is a tool that helps everyone about the same.
One counterintuitive subgroup. Emergency radiologists had the highest concordance with AI at 98.66%, higher than thoracic radiologists at 97.26%. The likely reason is pretest probability, ER reads a higher-prevalence CTPA population, where the tool does its best work.
Single network. Suburban-urban New York, one integrated system. The authors are explicit that it may not transfer to rural settings, different scanner mixes, different populations, or a different vendor.
One number to keep in your pocket. A prior blinded multicenter validation of this tool, 499 cases across six US sites, reported about 94% sensitivity. Real-world AI-alone sensitivity here was 85%. That is a cross-study comparison, not a controlled before-and-after, so I would not treat the gap as exact. But a high single-digit drop from validation to production is the kind of context that should anchor any conversation with a vendor about their internal numbers.
Leadership angle. If you are evaluating PE AI or already running one, this is your benchmark. The incremental catch rate, 0.81% of positives, is the real value, not the 97.79% headline, and the AI Quality Oversight Process is what turned “we bought a tool” into “we know how it performs.” If adjudication resources are tight, the authors point to the AI-positive/radiologist-negative discordances first: rarer, about a quarter of disagreements, but overturned in the AI’s favor 14.36% of the time against 10.22% the other way.
Quick hit: how to know your deployed AI is still working
Sorin et al., Journal of the American College of Radiology, November 2025. DOI: 10.1016/j.jacr.2025.06.036
The natural sequel. Mayo Clinic, 11,999 CTPAs. An LLM reads the radiology report, the imaging AI reads the scan, and you track the daily disagreements between the two against a stable baseline to catch drift. The finding I would keep: drift is easier to see when a model turns falsely positive than when it starts missing. A 2 to 3% drop in specificity showed up within weeks, but it took a 10% drop in sensitivity to raise the same flag. So the failure that hurts the patient, the missed PE, is the one your monitor is slowest to catch. It is one of the few monitoring frameworks published for radiology, and worth reading if you run AI in production.