Scoring the scan, not the lesion
PI-QUAL v2, and what the real-world quality data shows
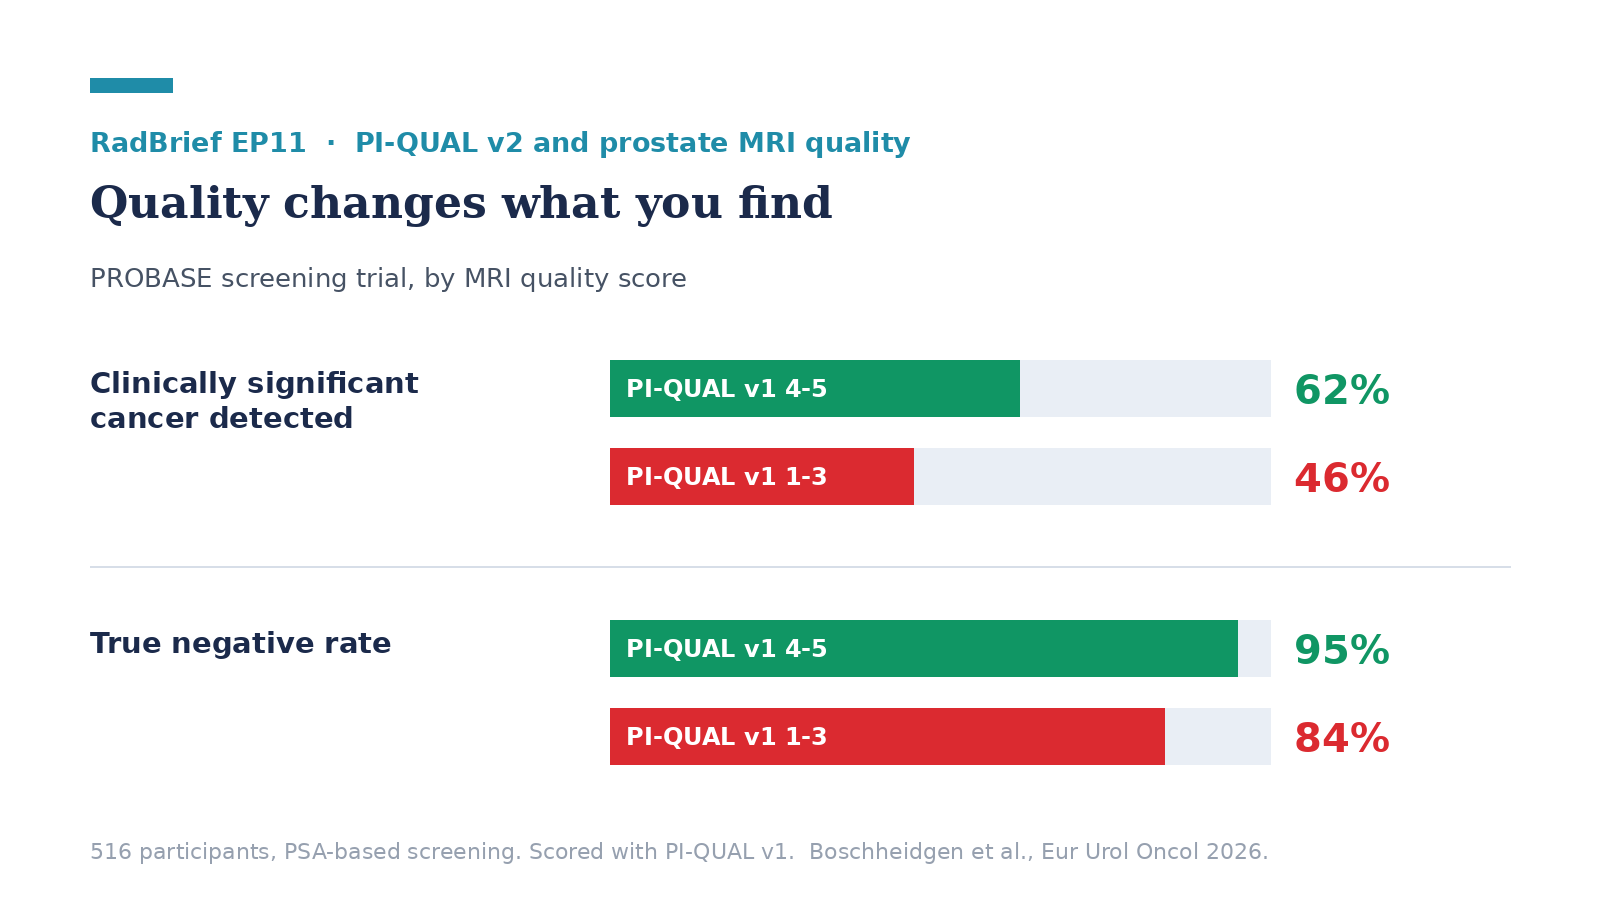
In the PROBASE screening trial, men whose MRI was rated lower quality had clinically significant cancer detected 46% of the time. In the higher quality group it was 62%. Same trial, same biopsy protocol, same PI-RADS threshold for going to biopsy.
The difference was the scan.
There is a score for this and it was updated in 2024. PI-QUAL version 2 is shorter than version 1, it works without contrast, and it changes what counts. This is what I said I’d come back to at the end of the PRECISE episode, I expected to write about the update. Most of this ended up being about the three quality papers that have come out since.
Where the score came from
PI-QUAL scores the examination, not the lesion.
Francesco Giganti and colleagues built it inside the PRECISION trial and published it in 2020, using 58 of the 252 trial scans chosen at random across the 22 participating centers, scored in consensus by two experienced radiologists blinded to pathology. Of those scans, 95% were of sufficient diagnostic quality, meaning PI-QUAL 3 or better. Only 60% reached 4 or 5.
By sequence, T2-weighted imaging was diagnostic in 95%, DWI in 79%, and DCE in 66%. That is a well-run multicenter trial with protocol oversight and central coordination. So 60% reaching 4 or 5 is probably a ceiling, not an average.
What version 2 changed
Version 2 came out in 2024 from a much wider group: 20 genitourinary radiologists and six urologists drawn from ESUR, ESUI, and invited members of the SAR prostate panel. Andrei Purysko at Cleveland Clinic is among the authors.
What changed, version 1 in 2020 against version 2 in 2024:
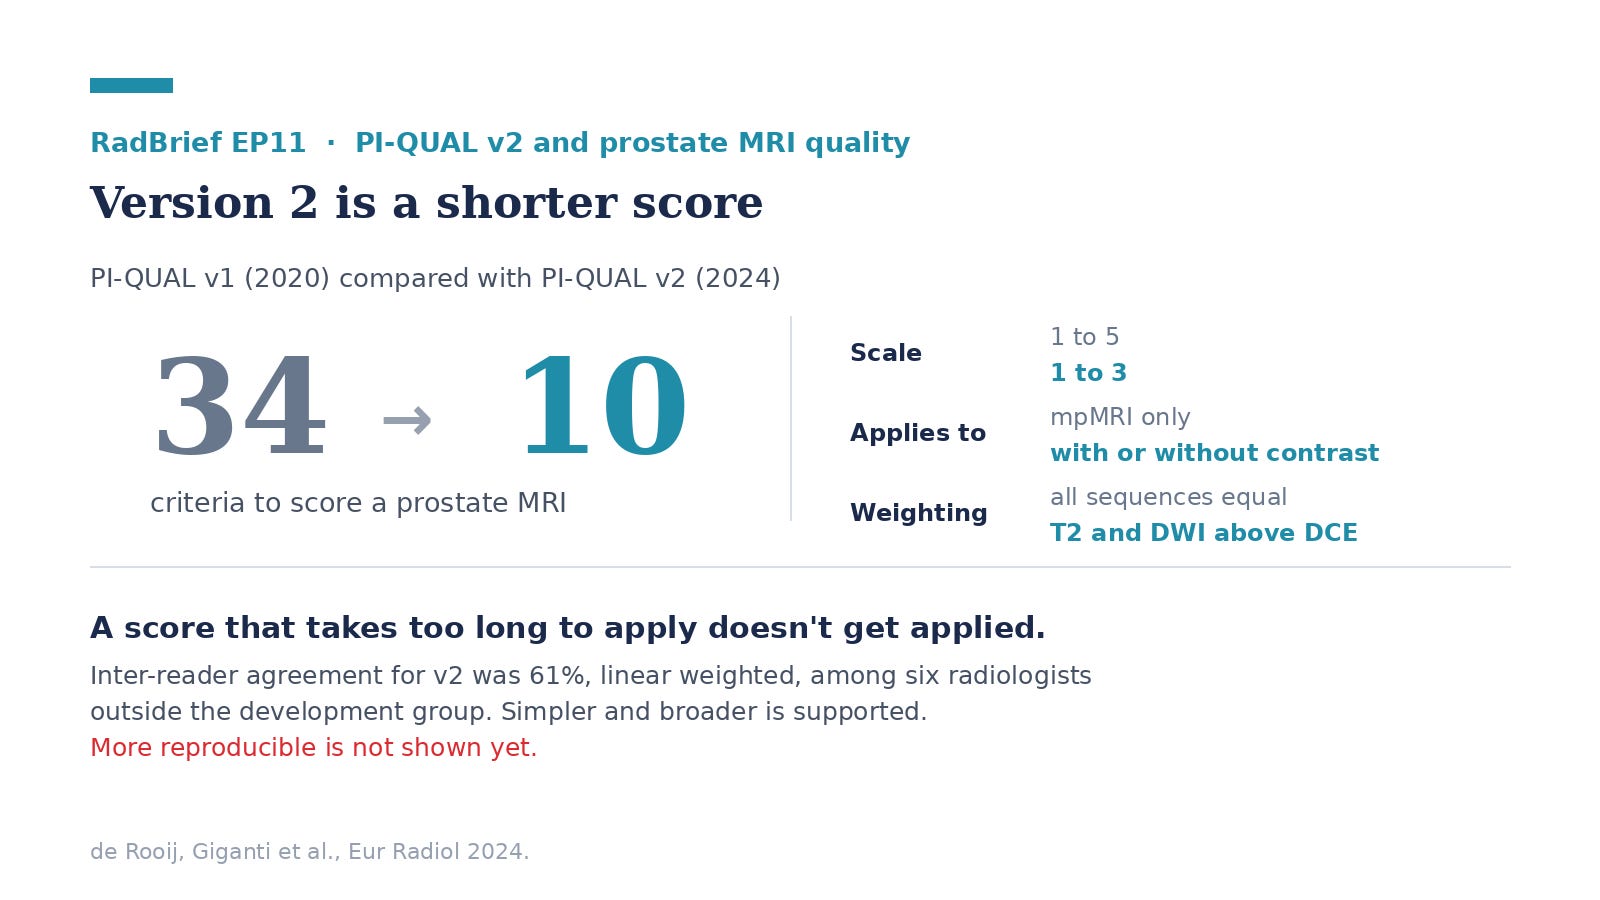
Criteria: 34 down to 10
Scale: 1 to 5 down to 1 to 3
Scope: mpMRI only, now mpMRI and MRI without IV contrast
Authorship: built by the PRECISION trial researchers, now by an expanded international working group
Method: checked compliance with all PI-RADS v2 technical recommendations, now defines the essential technical requirements per sequence and checks them before assessment
Weighting: all sequences equal, now T2-WI and DWI above DCE
Thirty-four criteria down to ten is the change that matters most, and it’s deliberate. A score that takes too long to apply doesn’t get applied.
Version 2 splits the work into two steps: the essential technical prerequisites per sequence are checked first, and then the 10 criteria assess the images themselves.
The weighting change follows PI-RADS. DCE upgrades a peripheral zone PI-RADS 3 to a 4 and has no role at all in the transition zone, so giving it equal weight in a quality score was never quite right.
The score, in short
Screenshot this part.
Per sequence
T2-WI: four criteria, maximum 4/4
DWI: four criteria, maximum 4/4
DCE: two criteria, scored as + or -
MRI without IV contrast
1, inadequate: T2-WI and/or DWI scores 2/4 or less
2, acceptable: both score at least 3/4
3, optimal: both score 4/4
mpMRI
Same thresholds, then DCE adjusts
Both DCE criteria met, plus either T2-WI or DWI at 4/4, lifts a 1 to a 2
A 3 drops to a 2 if both DCE criteria are not met
A 2 does not move in either direction
The recommendation that matters most is not part of the score. The authors say that when diagnostic quality is inadequate, the PI-RADS or Likert score should not be given, and specifically that an inadequate scan should not be allocated a PI-RADS 3. But the same paper says the score should inform clinical decisions rather than determine them, and that a large lesion on a PI-QUAL 1 scan can still go to targeted biopsy without delay.
The part I’d hold onto is narrower. I don’t think a scan that can’t answer the question should be reported as a PI-RADS 3.
What the quality data shows
Three papers, in the order I’d rank them.
Adherence is uneven, and the gaps are specific. Alley and colleagues scored the prostate MRIs from NRG-GU005, 600 men imaged across 124 institutions before radiotherapy. Most of the PI-RADS minimum technical standards held: 82% of them had adherence above 75%. The failures were narrow.
T2 in-plane dimension met the standard in 57% of datasets, DWI field of view in 62%, and only half used the recommended high b value to compute the ADC map.
The cost is measurable. PROBASE is a population and PSA based screening study in men aged 45, and this substudy covers 516 participants who went to combined targeted and systematic biopsy. It scored quality with PI-QUAL v1, on the 1 to 5 scale. Scans rated 1 to 3 had a clinically significant cancer detection rate of 46% against 62% for scans rated 4 or 5, and a true negative rate of 84% against 95%.
The same paper separates the reader from the scan: expert reference reading beat local reading on sensitivity, 83% against 69%, and local reads missed clinically significant cancer in PI-RADS 1 to 2 in 17.1% of cases against 2.9%. Two different problems, both real, measured in the same cohort.
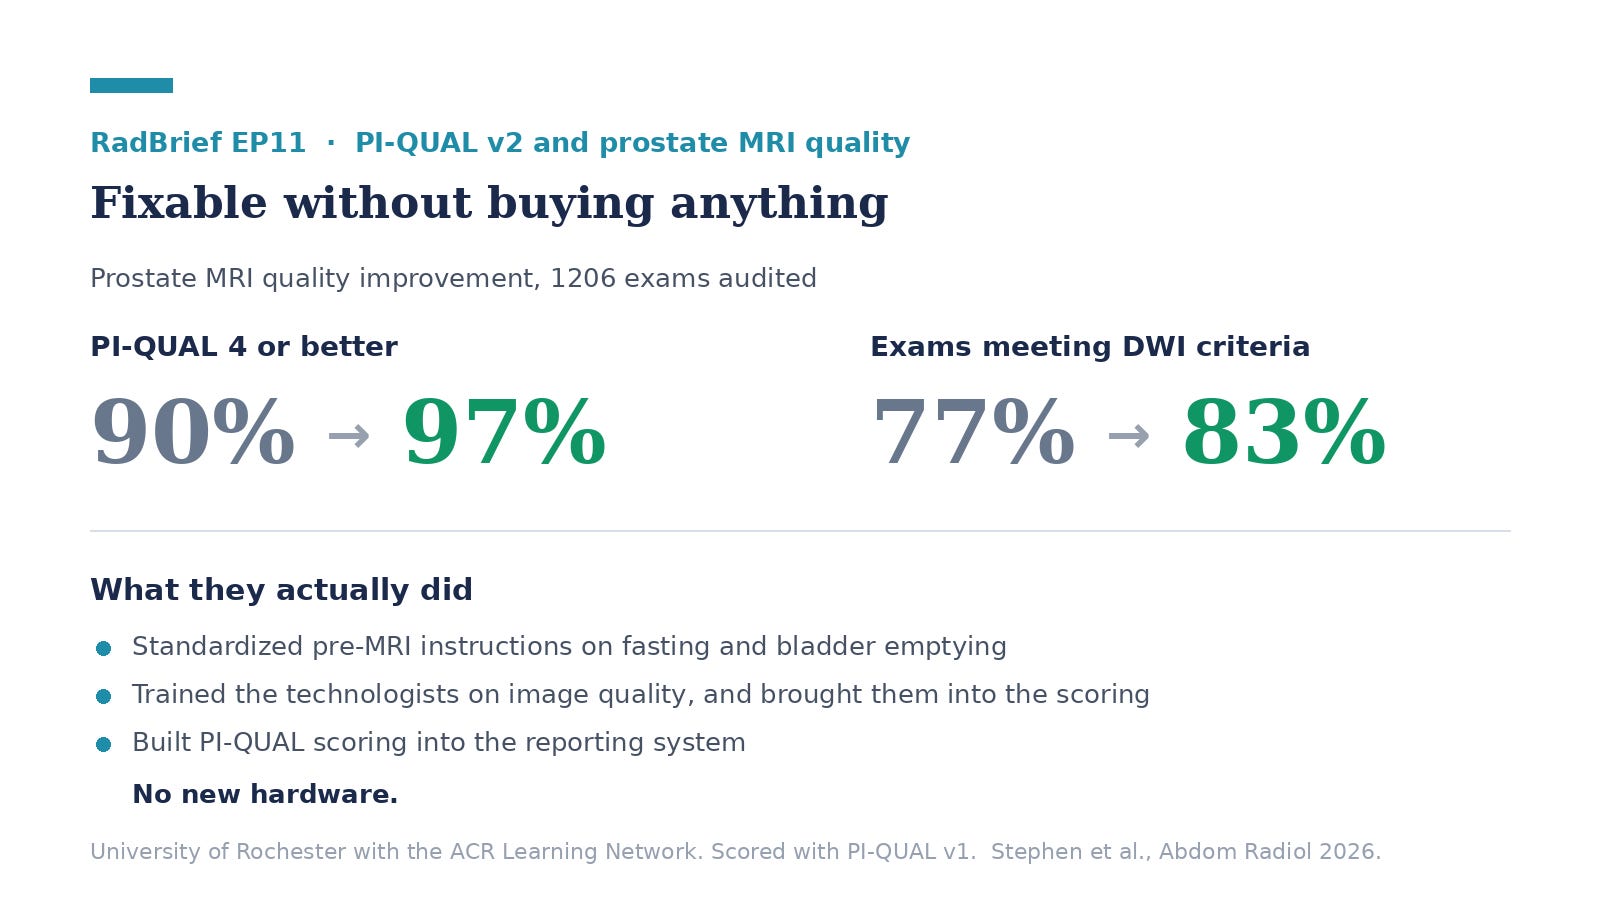
It is fixable without buying anything. A quality improvement team at the University of Rochester, working through the ACR Learning Network, audited 1206 prostate MRIs.
They standardized the pre-MRI instructions on NPO status and bladder emptying, trained the technologists on image quality and brought them into the scoring, and eventually built PI-QUAL scoring into the reporting system. Exams rated 4 or better on PI-QUAL v1 went from 90% to 97%, and exams meeting the DWI criteria went from 77% to 83%.
What I’d tell a resident
A resident should be able to recognize a scan that can’t be read before getting good at characterizing what’s on it. Most of the 10 criteria are about whether the anatomy is actually visible: the capsule, the seminal vesicles, the ejaculatory ducts, the neurovascular bundles, the external urethral sphincter.
If those aren’t resolvable, staging is guesswork no matter how confident the lesion call feels.
T2 and DWI carry the score, so those are the two to protect. And the part I’d put above the rest: an inadequate scan shouldn’t be reported as a PI-RADS 3. PI-RADS 3 is where uncertainty goes, but there’s a real difference between a lesion that is genuinely indeterminate and a scan that can’t answer the question.
Scoring the second one as a PI-RADS 3 hides a technical failure inside a clinical category, and then the failure is invisible to everyone downstream.
What I’d tell a general radiologist
Most places aren’t scoring quality at all. We do score it where I work, but one of the v2 authors is on staff, so I don’t think we’re typical.
The value isn’t really the number in the report.
It’s that scoring gives you a reason to talk to the technologists on a schedule. Rochester’s improvement didn’t come from a better magnet, it came from patient preparation and from technologists who were part of the scoring instead of the recipients of complaints. The other reason to care is that a poor scan doesn’t announce itself. It reads as a negative study.
That’s the expensive failure, and PROBASE puts a number on it with the true negative rate falling from 95% to 84%.
What to be skeptical about
The version gap. PROBASE scored its MRIs with PI-QUAL v1, and so did Rochester. All of the outcome evidence that quality changes detection is v1 evidence.
Version 2 is the better designed instrument on paper, but the studies linking it to detection rates haven’t been done yet, and it’s worth being honest that we are extending a v1 finding to a v2 tool.
Reproducibility. The v2 paper reports its own inter-reader agreement at 61%, linear weighted, from six radiologists who weren’t involved in developing it scoring 50 studies.
Fleming and colleagues found the same pattern for v1: agreement on the exact score was moderate, and only became good when the scores were collapsed into 1 to 3 versus 4 to 5.
So “simpler and broader” is supported. “More reproducible” isn’t shown yet, and the authors say so themselves and ask for intra-reader studies.
Where the data comes from. Fleming also found that scans from academic teaching hospitals scored much higher than scans from a community hospital, 4.6 against 2.9 for the experienced reader.
If quality is worst where a second opinion is hardest to get, then the people measuring quality are working in the places with the least of the problem.
I don’t think the number is the point. Scoring is what makes the conversation with the technologists happen at all, and that conversation is where Rochester’s 90 to 97 actually came from.
Deeper reading
Primary
de Rooij M, Allen C, Twilt JJ, et al. PI-QUAL version 2: an update of a standardised scoring system for the assessment of image quality of prostate MRI. Eur Radiol 2024;34(11):7068-7079. https://doi.org/10.1007/s00330-024-10795-4
Giganti F, Allen C, Emberton M, et al. Prostate Imaging Quality (PI-QUAL): A New Quality Control Scoring System for Multiparametric MRI of the Prostate from the PRECISION trial. Eur Urol Oncol 2020;3(5):615-619. https://doi.org/10.1016/j.euo.2020.06.007
Boschheidgen M, Al-Monajjed R, Schlemmer HP, et al. MRI Quality and Reader Experience in Organized Prostate Cancer Screening: Insights from the PROBASE Trial. Eur Urol Oncol 2026. https://doi.org/10.1
Stephen SJ, Rosella P, Weinberg E, et al. A collaborative approach to improving prostate magnetic resonance image quality. Abdom Radiol 2026;51(2):865-877. https://doi.org/10.1007/s00261-025-05049-w
Alley S, Tonneau M, Olivie D, et al. Assessing Quality and Adherence to PI-RADSv2.1 Minimum Technical Standards of Prostate MRI in NRG-GU005. J Magn Reson Imaging 2025;63(2):464-474. https://doi.org/10.1002/jmri.70142
Fleming H, Dias AB, Talbot N, et al. Inter-reader variability and reproducibility of the PI-QUAL score in a multicentre setting. Eur J Radiol 2023;168:111091. https://doi.org/10.1016/j.ejrad.2023.111091
Foundational
Turkbey B, Rosenkrantz AB, Haider MA, et al. Prostate Imaging Reporting and Data System Version 2.1: 2019 Update. Eur Urol 2019;76(3):340-351. https://doi.org/10.1016/j.eururo.2019.02.033
Kasivisvanathan V, Rannikko AS, Borghi M, et al. MRI-Targeted or Standard Biopsy for Prostate-Cancer Diagnosis (PRECISION). N Engl J Med 2018;378(19):1767-1777. https://doi.org/10.1056/NEJMoa1801993
Turkbey B, Choyke PL. Editorial accompanying the PI-QUAL v1 release. Eur Urol Oncol 2020;3(5):620-621.
Previously on RadBrief
EP10, PRECISE for prostate active surveillance, which is where I said scan quality was the next thing to look at.